Why research on non-users is relevant in B2C business

Ever since I first read the publication on the 2010 study of communication technology use by Finland's official statistics service (Tilastokeskus), I thought it would be great to visualise some of the data contained. In particular, I wanted to dissect the "official" numbers on the use of SNSs in Finland and put them into context with my research on non-users.
On February 8, I was invited by the digital agency Valve to speak at the event "600Minutes BtoC Marketing". It was an interesting exercise to analyse and process the outcome of my research on "The Absent Peer - Non-users in Social Interaction Design" for an audience of marketing executives from some of the biggest companies in the country.
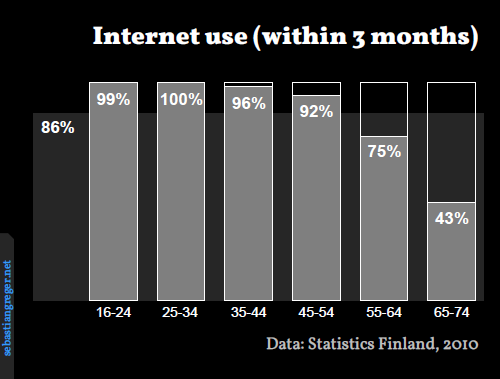
Internet use in everyday life: reach and frequency
To add some hard numbers to my otherwise qualitative discussion, I decided to start off with a visualisation of statistics on the use of the internet and SNSs in Finland by the national statistics office.
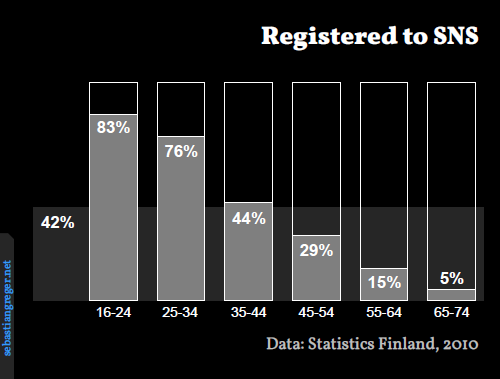
First off, I draw an overall picture of how the 86% of the population that are using the internet are distributed over the different age groups. Then, I went on visualising the percentage of each age group that is using a social network site (this includes Facebook, Twitter and others not mentioned in the report). Since data exists on the frequency of their use, this allowed for the creation of an animated series of slides to visualise how the numbers decrease when investigating how big is the share of the population using SNSs on a weekly basis, daily or even multiple times a day (up to almost "real-time"):
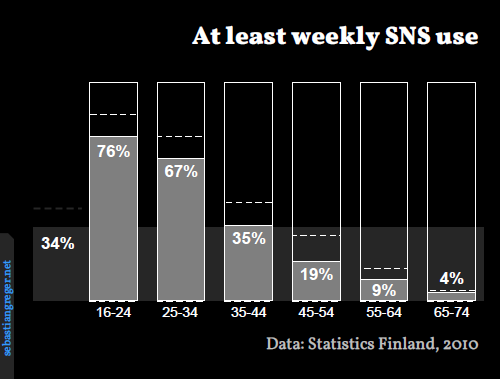
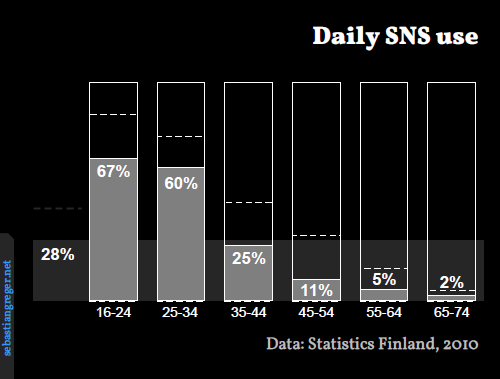
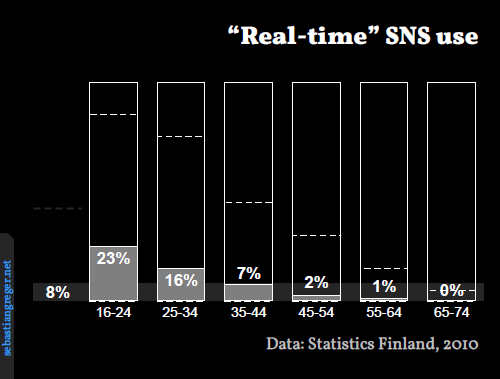
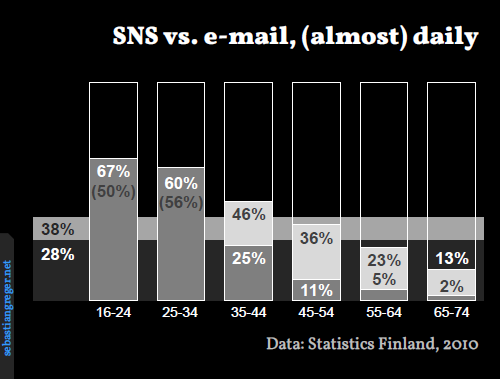
Already the numbers for the "at least daily" users are surprisingly low beyond the age of 35. And the low share of the population that is using SNSs in real-time (i.e. more than once a day, up to constant connectivity) is a clear indicator that clues such as "people are all the time on Facebook nowadays" are - and based on my ethnographic research, I am not surprised - just a hype.
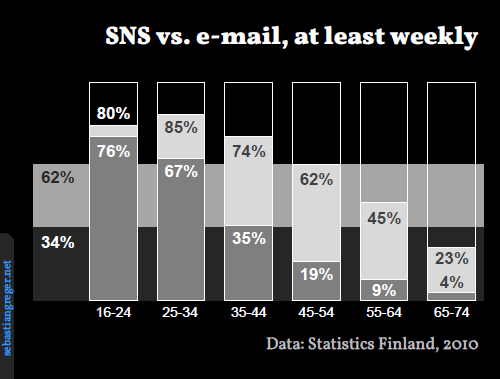
I then added the values how Finns use e-mail for personal purposes - again, first for "at least weekly" and then "at least once a day". It appears that e-mail is a lot less dead than often claimed (and below statistics don't even include the use of e-mail in a professional context). However, among the youth and young adult age groups, the SNSs already reach more people on a daily basis than e-mail - an interesting insight and maybe an indicator that indeed some change is going on.
The data I referred to is only a very small subset of what the report has to provide. It is definitely a worthwhile read for everybody (speaking Finnish and) working with the internet - in design as well as in business.
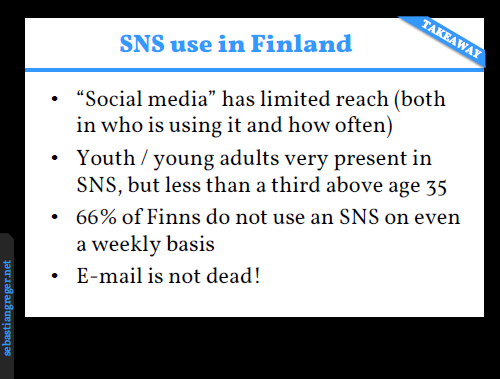
Based on my argumentation, I summarised the most important findings from the statistics into a slide with four statements on how SNSs are used in Finland:
Online conversation and patterns of use
Next, I concentrated on the behaviour of those using "social media", by referring to the "Social Technographics" categorisation by Forrester Research (2007, 2010) which clearly indicates that internet users' engagement with these services is limited. Forrester's model groups internet users (the base are all internet users in the US) into creators, conversationalists, critics, collectors, joiners, spectators and inactives. Interesting observations regarding the numbers from 2010 are that:
- only 30% of users participate in the production of "social content",
- 30% do not consume "social content", and
- 17% of internet users do not encouter social technologies at all.
I also referred to a study by RJMetrics from 2009, visualising that only about 25% of Twitter users actively post messages to the service (well in line with the findings by Forrester). To illustrate how different people's use can be from the intended design of an SNS, I told the story of Mikalah, a Facebook user encountered and described by danah boyd, who disables her account every time instead of logging out from the service (to stay in control over her personal content there).
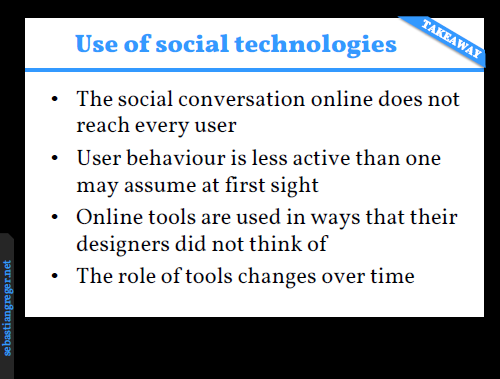
After sharing a few observations from my own ethnographic work, I summarised this second part of the presentation with a takeaway of four statements:
Rethinking "the user"
In the third part of my presentation, I then turned the attention to the non-users. To build a bridge from the earlier exploration on the different ways users engage with SNSs, I quoted Sally Wyatt ("Non-users also matter: The construction of users and non-users of the internet", 2003):
users are not simply passive recipients of technology; they are active and important actors in shaping and negotiating meanings of technology
To emphasise how internet users are not just passively "consuming", but how they interpret the offering based on their own understanding, I explained how a "Like us on Facebook to win an iPad" campaign is seen as a way to build an audience by the enterprise, but for the user it might just be a way to enter a prize draw (with no interest to become part of an audience).
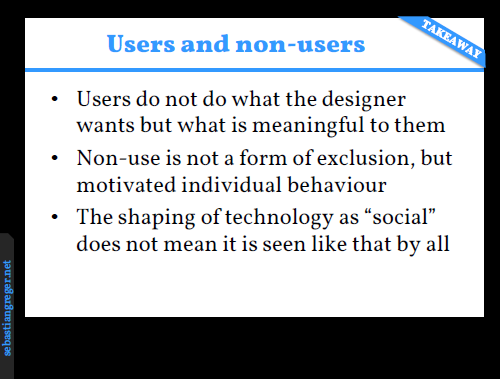
Next, I provided some general insights on non-users from my research - "use and non-use as one phenomenon", the "six categories of non-use" and "non-use as a form of use" (see my research report, pages 39-51 for details) - which led to another summary:
Conclusions
Summing it up, I presented a set of conclusions that emphasise why the insight on users' as well as non-users' behaviour is an important consideration not only for designers (to whom my own research is primarily targeted), but for marketers as well:
- Consumers as users are a heterogeneous crowd: there are no “one size fits all” solutions to reach everybody
- There is a need for research and insight beyond the mechanisms of mainstream “social media”
- The utilisation of less obvious “social technology” (apart from SNSs) remains highly valuable, e.g. e-mail
- Own channels stay extremely important
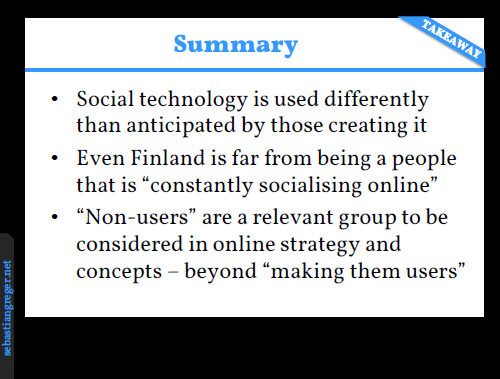
My presentation closed with a summary slide with the three most important takeaways from the research presented:
A big thank you to Valve and Management Events for the invitation, and to the audience for the interest and the conversations afterwards. Please feel free to continue the discussion below - all of this is constant work in progress and I'm curious to hear your opinion!
Bibliography
Greger, S. (2010). The Absent Peer - Non-users in Social Interaction Design (Unpublished Master’s Thesis). Aalto University, Helsinki, Finland. Retrieved from http://www.sebastiangreger.net/absentpeer
Tilastokeskus. (2010). Tieto- ja viestintätekniikan käyttö 2010. Retrieved from http://www.tilastokeskus.fi/til/sutivi/2010/sutivi_2010_2010-10-26_fi.pdf
Wyatt, S. (2003). Non-users also matter: The construction of users and non-users of the internet. In N. Oudshoorn & T. Pinch (Eds.), How users matter. Cambridge, Mass.: MIT Press.